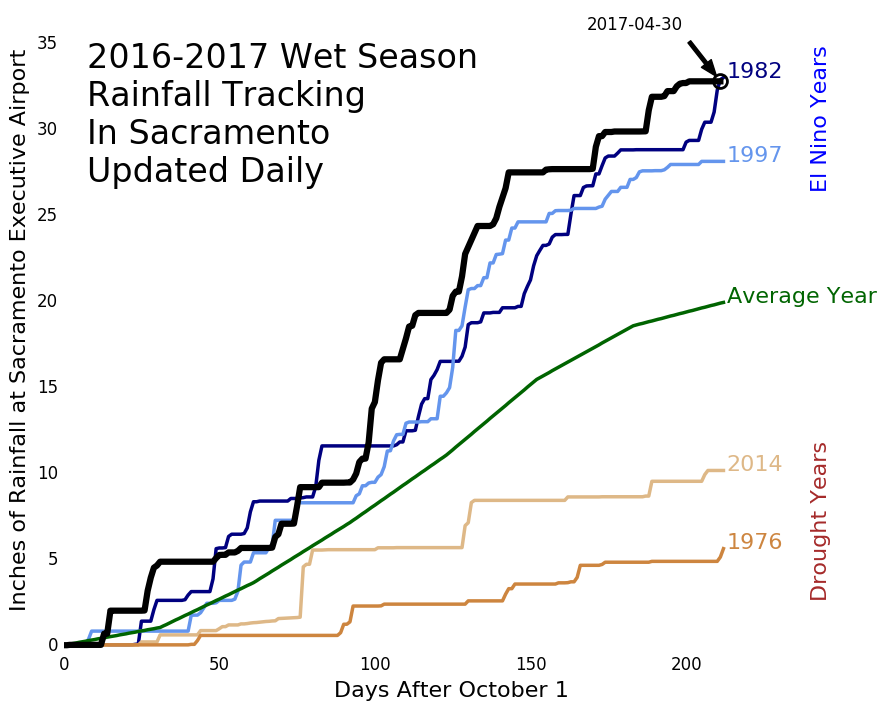
I created this chart because I wanted a graphical way to compare rainfall amounts this year as compared to previous years. Since I can remember our two driest years in California (1975 and 1976) and I also remember the wettest year (1982), I thought it’d be fun to watch this year’s progress.
That turned out to be an interesting decision because unbeknownst to me, it turned out to be Sacramento’s wettest season on record.
These are Sacramento records from the rain gage at Sacramento Executive Airport, so the graph doesn’t really tell us much about the status of the drought Statewide. But it does show us how rainfall in Sacramento compares to past notable weather seasons. The rainy season is defined here as starting on October 1 and continuing through the following April. Values for this season (2016-17) were updated daily at 10 a.m. PST with the previous day’s rainfall. The data comes from cdec.water.ca.gov.
The data from past years comes from UCDavis
In Sacramento, the driest year was 1975 (just 7.25 inches), and the second driest year was the next year at only 7.53 inches.
The wettest years in Sacramento are associated with the El Nino patterns of 1982 and 1997. 1982 was the wettest year in Sacramento history since records were kept beginning in 1849 at 37.49 inches. 1997 was the second wettest year of the 20th century in Sacramento at 32.25 inches. Curiously 2015-2016 was a strong El Nino, but a complete dud interms of rain.
Good historical rainfall information can be found at NOAA
Source code is on my github