

Well played Belgium

Nice seafood spot in Midtown

Good morning

Hiking up to https://www.sotadata.org.uk/en/summit/EI/IS-040

Pleased with all the parks and gardens of Dublin

Fun tour, interesting photo printing.

Off to Dublin
Quick text-based Markdown-inspired Gantt charts
Everyone needs to make a schedule at some point, but most tools are complicated, heavyweight, and not easy to share. As someone working in a corporate engineering environment, I need to do create and share schedules constantly.
It would be convenient to share a schedule as a simple text file to put in a mono-spaced email section or Microsoft Teams window. The usual options aren’t great — a full Microsoft Project file is overkill, a spreadsheet doesn’t paste well into chat, and a hand-drawn ASCII chart is tedious to maintain. What I wanted was something as simple as Markdown: a plain text format I could type quickly, that would render into something clear and readable and could be dropped straight into a Teams message. The result is ganttdown, a lightweight Gantt chart tool that turns a simple text file into a monospaced chart you can paste anywhere. It was vibe-coded with Claude.
The web version is available at ganttdown.dougfredericks.net.
How It Works
ganttdown reads a schedule written inside a <task> block. You can embed this block in any plain text or Markdown file — everything outside the block is ignored, so you can surround your schedule with notes, headings, or narrative text.
Each task is a single line with four fields in a fixed order:
<task#> <name> <YYYY-MM-DD or dep#> <duration>- Field 1 — Task number using dotted hierarchy, e.g.
1,1.1,2.3 - Field 2 — Task name — everything between the task number and field 3
- Field 3 — Either a start date in
YYYY-MM-DDformat, or the number of a task this one depends on - Field 4 — Duration in working days (Monday–Friday only)
A complete schedule looks like this:
<task>
// Phase 1
1.0  Project Kickoff  2026-04-13  1
1.1  Get Project Data 2026-04-13  5
1.2  Design           1.1         5

// Phase 2
2.1  Submit to client      1.2         10
2.2  Respond to comments   2.1         5
2.3  Construction          2.2         2
</task>
Lines beginning with // are comments and are ignored. Blank lines are also ignored. The parser figures out what each field is by its shape — a date looks like 2026-04-13, a dependency looks like 1.1, and a duration is a plain integer.
The Output
ganttdown produces a monospaced text chart with one column per working day, grouped by week. Dependencies are computed automatically — a task with a dependency starts the next working day after all its predecessors finish. Weekends are skipped in both durations and the chart grid.
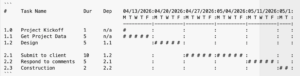
In text, which may look bad depending on the width of your screen, the schedule looks like this:
#     Task Name             Dur    Dep    04/13/2026:04/20/2026:04/27/2026:05/04/2026:05/11/2026:05/1:
                                          M T W T F :M T W T F :M T W T F :M T W T F :M T W T F :M T :
                                          ----------:----------:----------:----------:----------:----:
1.0   Project Kickoff       1      n/a    #         :          :          :          :          :    :
1.1   Get Project Data      5      n/a    # # # # # :          :          :          :          :    :
1.2   Design                5      1.1              :# # # # # :          :          :          :    :

2.1   Submit to client      10     1.2              :          :# # # # # :# # # # # :          :    :
2.2   Respond to comments   5      2.1              :          :          :          :# # # # # :    :
2.3   Construction          2      2.2              :          :          :          :          :# # :
Using It in Microsoft Teams
Teams renders text wrapped in triple backticks as a monospaced code block, which preserves the chart alignment. The web app has a Copy for Teams button that wraps the chart in triple backticks automatically — paste it straight into a Teams message and it renders correctly.
Try It
The web app is at ganttdown.dougfredericks.net. Type or paste your schedule into the input area, click Generate, and use the Copy for Teams button to grab the result.


Gab’s birthday