In the recent Twitter Migration, in addition to trying out Mastodon, I’ve been seeing some people go back to blogs or platforms like Micro.blog, WordPress, Tumblr, WriteFreely (like Mastodon it’s a part of the Fediverse, but built for blogging instead of short posts) and variety of others. They?...
Author Archives: Doug
#FeedReaderFriday Love this idea.
IC-705 Winlink RMS Express/VARA/ARDOP Settings
Enough talk, here’s pictures.

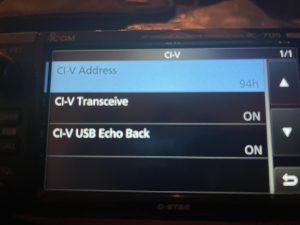
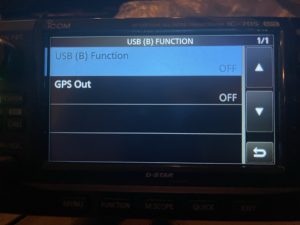
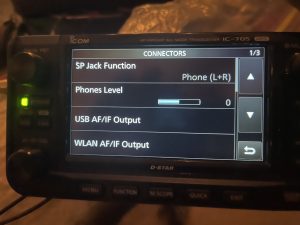
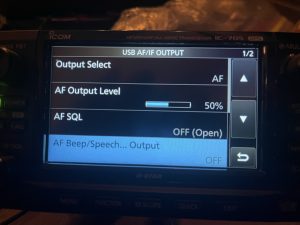
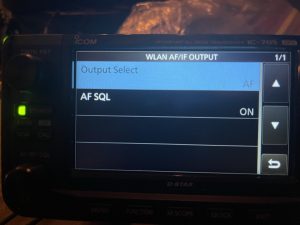
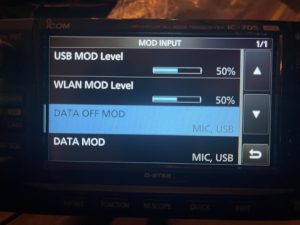
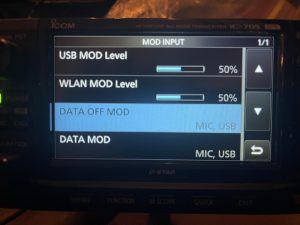
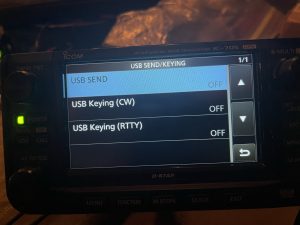
IC-705 and the Nomatic Accessory Case
I love my IC-705, it’s a really great portable radio. It sits at my desk during the day listening to broadcast stations, scanning local airbands frequencies, or listening for HF DX.
I also enjoy taking it with me for weekend mornings at a local park, for weekend getaways, etc. It doesn’t feel like a real sturdy traveler, with the exposed knobs and the large screen though. Luckily I had a chance to buy a case for a really good deal from Nomatic (https://www.nomatic.com/products/accessory-case).
I’ve been eyeing this one, but the price had been very high. They sent me an offer for a blemished product and I jumped on it. It arrived today and the fit is perfect. Take a look:
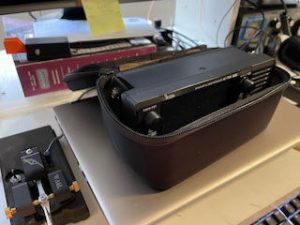
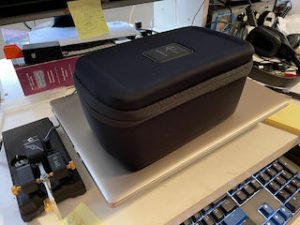
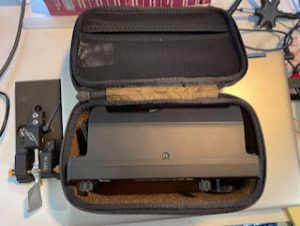

It fits snugly without feeling compressed. I highly recommend it if you are looking for a good travel case for your IC-705.
Elf Tradition Continues

We’ve been watching “Elf” with one of our neighbors for almost two decades! This year we invited our Covid-Cohorts to watch on a cold Saturday night.
Martini Fridays

We started this little event on our street at the beginning of COVID times. I think it’ll stick around longer than the virus. Hopefully we can expand the size in the future.
CWNews
Halfway thru 5 mile weekend walk and light stairs.
Installing #Davical as a #CalDav server
How is this working out, Johan? I’m thinking about running a CalDAV/CardDAV on a remote server.
We seek the grail

