
For my job as a bridge engineer, it is useful to have the most up-to-date information on bridges in California, Arizona, and Utah. Every year I download the latest bridge condition information compiled by the Federal government. This is a huge database of the detailed description, condition, use, and location of basically every bridge in the US. It’s pretty amazing.
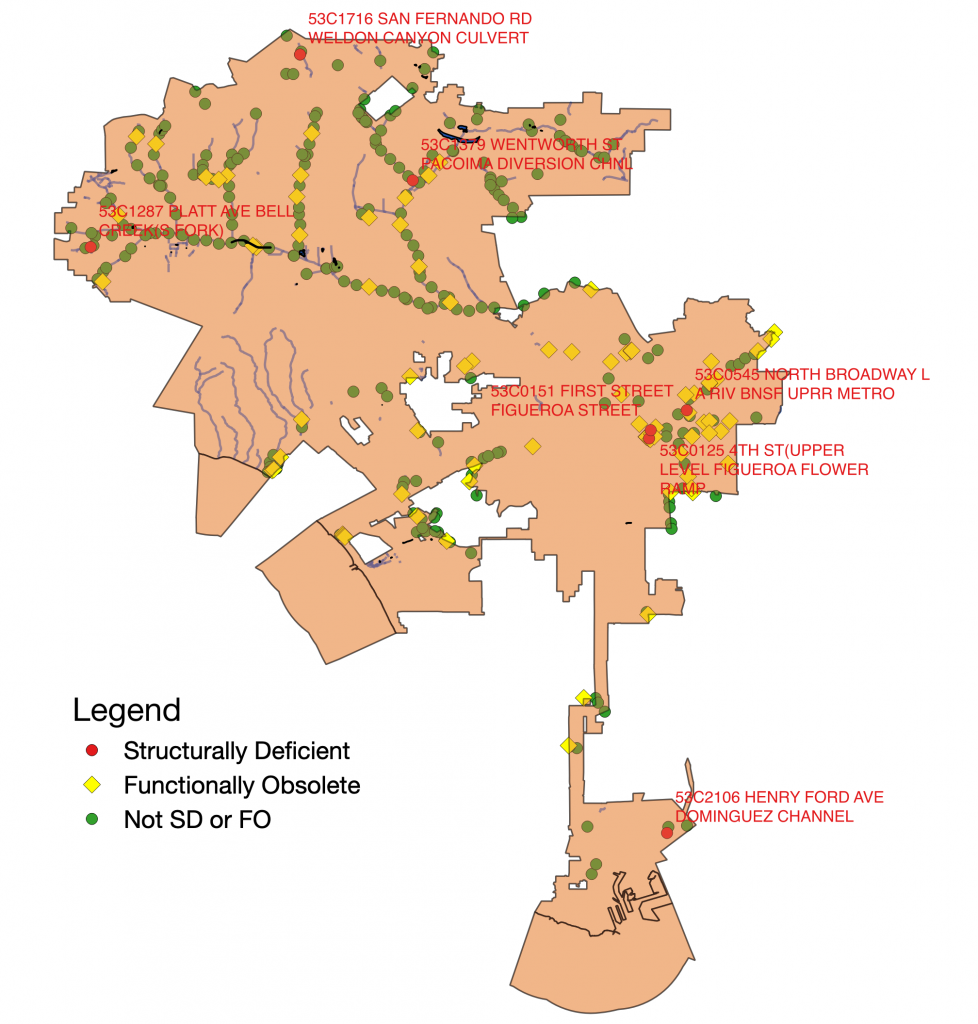
I wrote some python scripts to parse out the data and get it into a PostGIS-enabled PostgreSQL database. From there I can do pretty much anything, like create cool maps of, say, all the bridges in the City of Los Angeles, with the poorest condition bridges in red.:
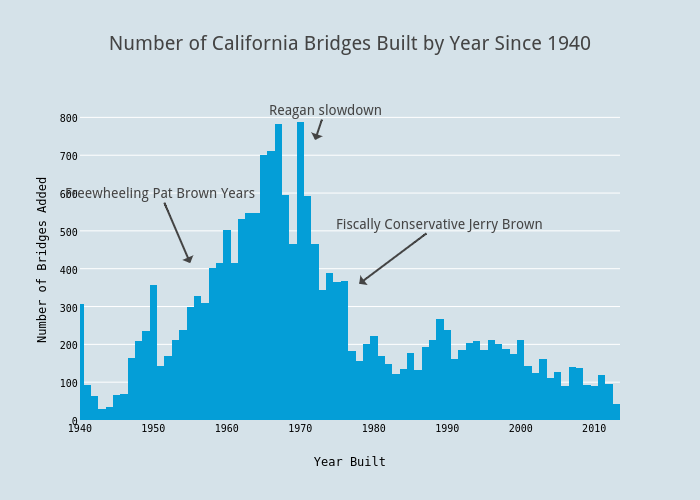
Or create a graphic of how many California bridges were built by year as the top image shows. Here’s the Plotly link.
If you know GIS and Python, take a look at my code. It works, but there are probably some improvements to be made.